Reviewing the quarter
Sydney, Australia
Sam Russell, Product Lead

We launched with a simple promise: accessible cost attribution, unit economics, and AI-powered financial intelligence for cloud environments, in one platform, rather than a patchwork of spreadsheets and half-answers. Since then we've been building on that promise, growing it piece by piece, into a unified tool to manage Technology Capital Performance, allowing you to quantify the cost and value of your operation.
None of it would mean much without the foundation underneath it, so that's where the real work went first. Resources are tagged the moment they're created, with historical spend automatically backfilled behind them, so attribution works from day one instead of waiting on months of manual cleanup. That same foundation is what let attribution stop being something configured field by field and start being something built in conversation instead, describe what you want, such as splitting a cost centre by product line, and Atlas drafts the change for you to review before anything is applied, with every change landing in the same audit trail as if you'd built it yourself.
Attribution only matters if it covers where the spend actually is, so the platform grew to meet it there.
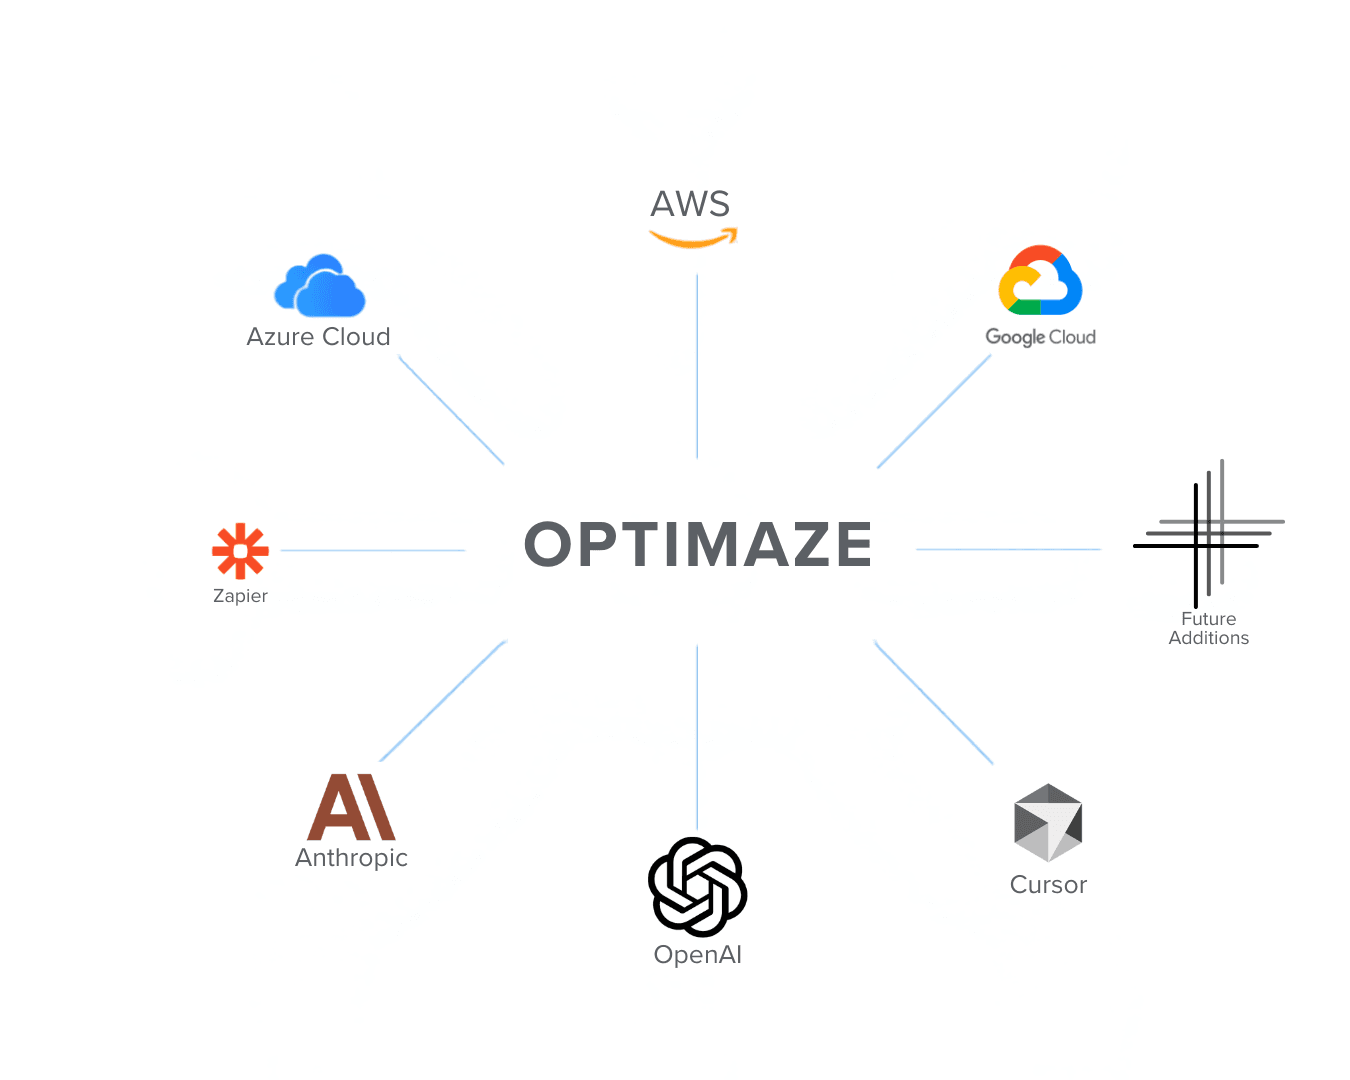
OPTIMAZE now allows multi-cloud attribution across major providers in a synthesised, cohesive representation, while on the AI side, Anthropic, Cursor, and OpenAI usage all sync in automatically, an acknowledgement that AI spend is no longer a side note on the cloud bill but a line item large enough to need the same rigour as the rest of it.
Once spend is attributed and covered, the next question is whether it's going where it's supposed to. Budgets let a team set an allocation at whatever level makes sense, a department, a product line, a shared platform cost, and watch actual spend track against it as it happens rather than at the end of the month. Goals do the same for anything measured as a target rather than a ceiling, updating on their own as the underlying numbers move, both scoped to the same structure the spend is already organised around.
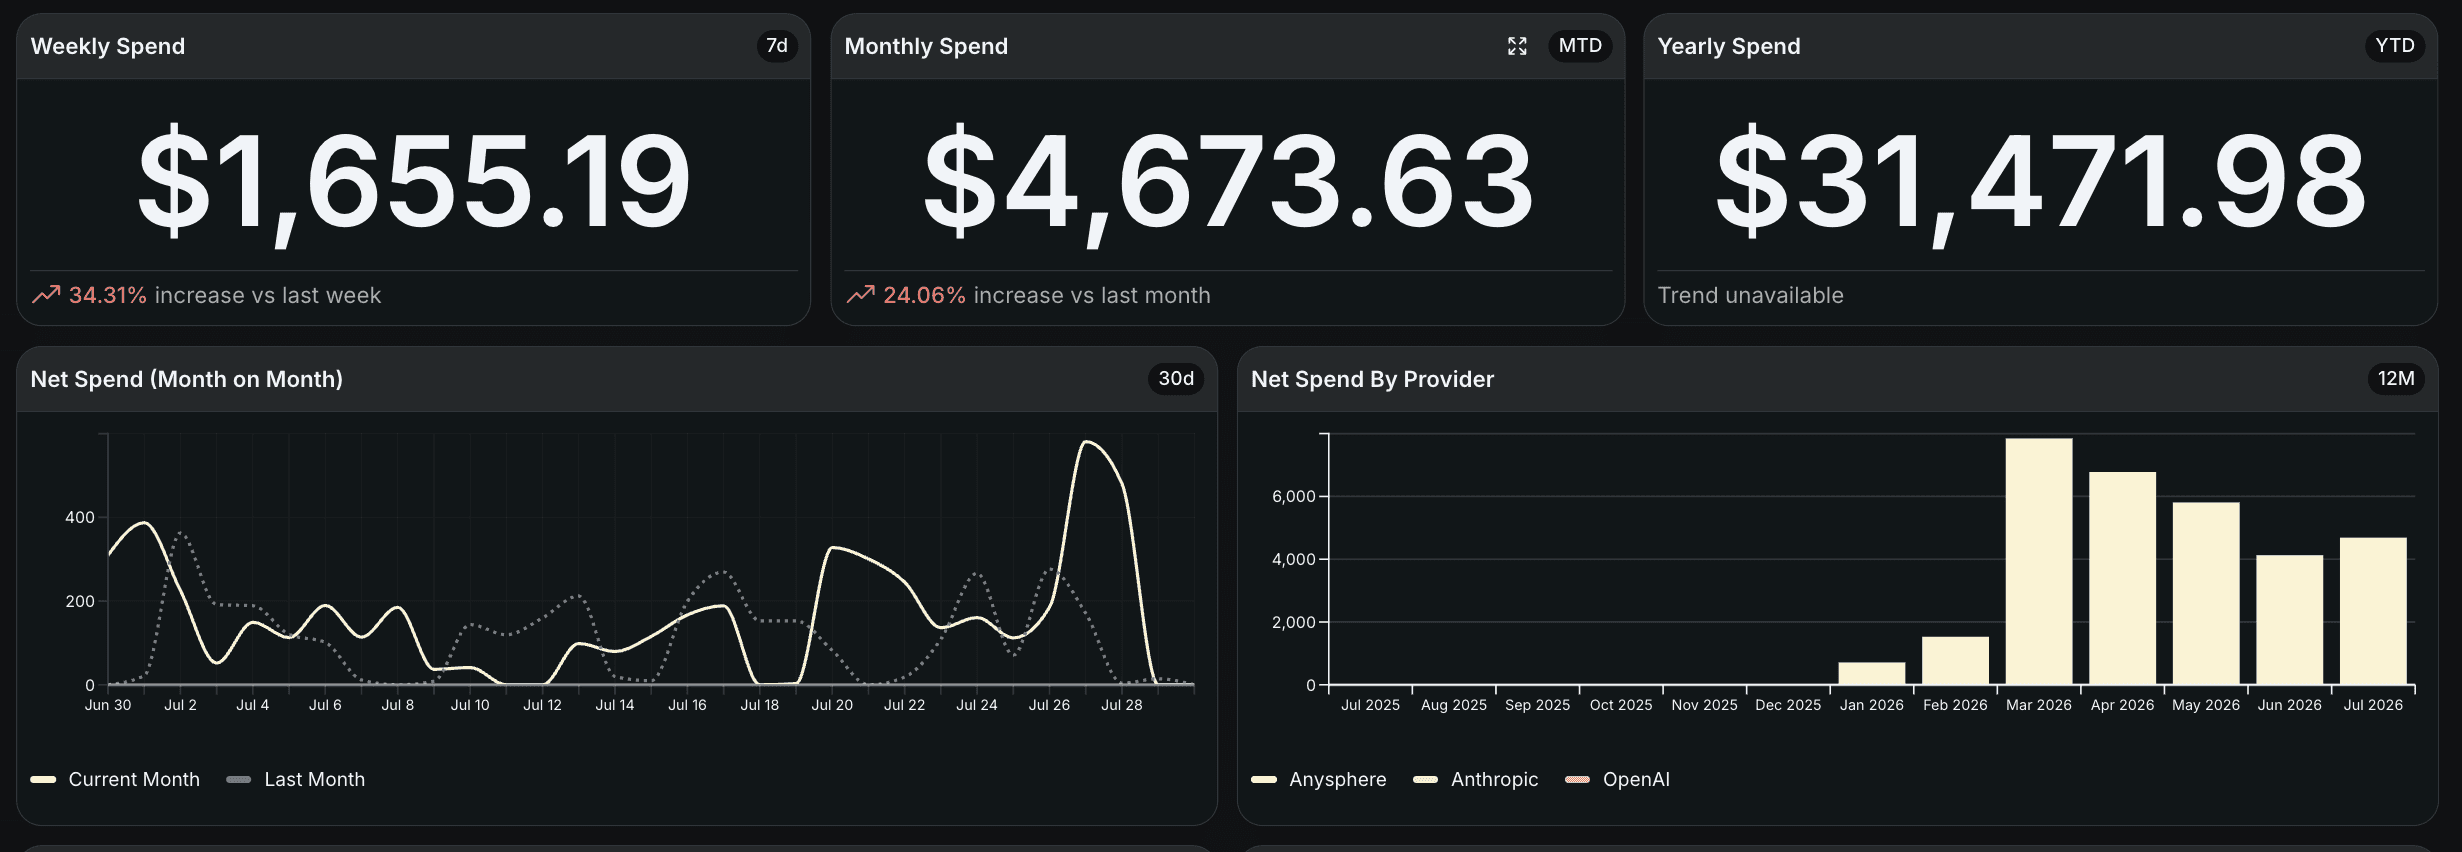
All of that needs somewhere to live that people actually use, which is where dashboards and filtering came in. Every team can now build the view of spend that matters to them, from a library of widgets rather than a fixed template built for someone else, and filtering got sharper alongside it, down to the level of an individual widget, so a dashboard can show exactly the slice of cost someone needs rather than a broad category standing in for it. A Zapier integration extended that same principle into unit economics, bringing the operational signals hiding in automated workflows into metrics like cost per customer, so a ratio reflects more than spend alone.
Underneath all of it sits the part customers don't see day to day but rely on completely: Optimaze is now ISO 27001 certified, an independent check on how we handle and protect the data customers are trusting us with as they hand over more of their financial picture.
What started as a promise about visibility has turned into a platform that attributes, tracks, plans, and explains, and does that work automatically rather than asking someone to go and find the numbers themselves. There's more coming. The changelog is the place to watch it happen.
Subscribe to our blog.
Never more than once a week.