Cheaper per call, more expensive per result: choosing AI models and commitments on cost per accepted output
Sydney, Australia
Ralf Capel
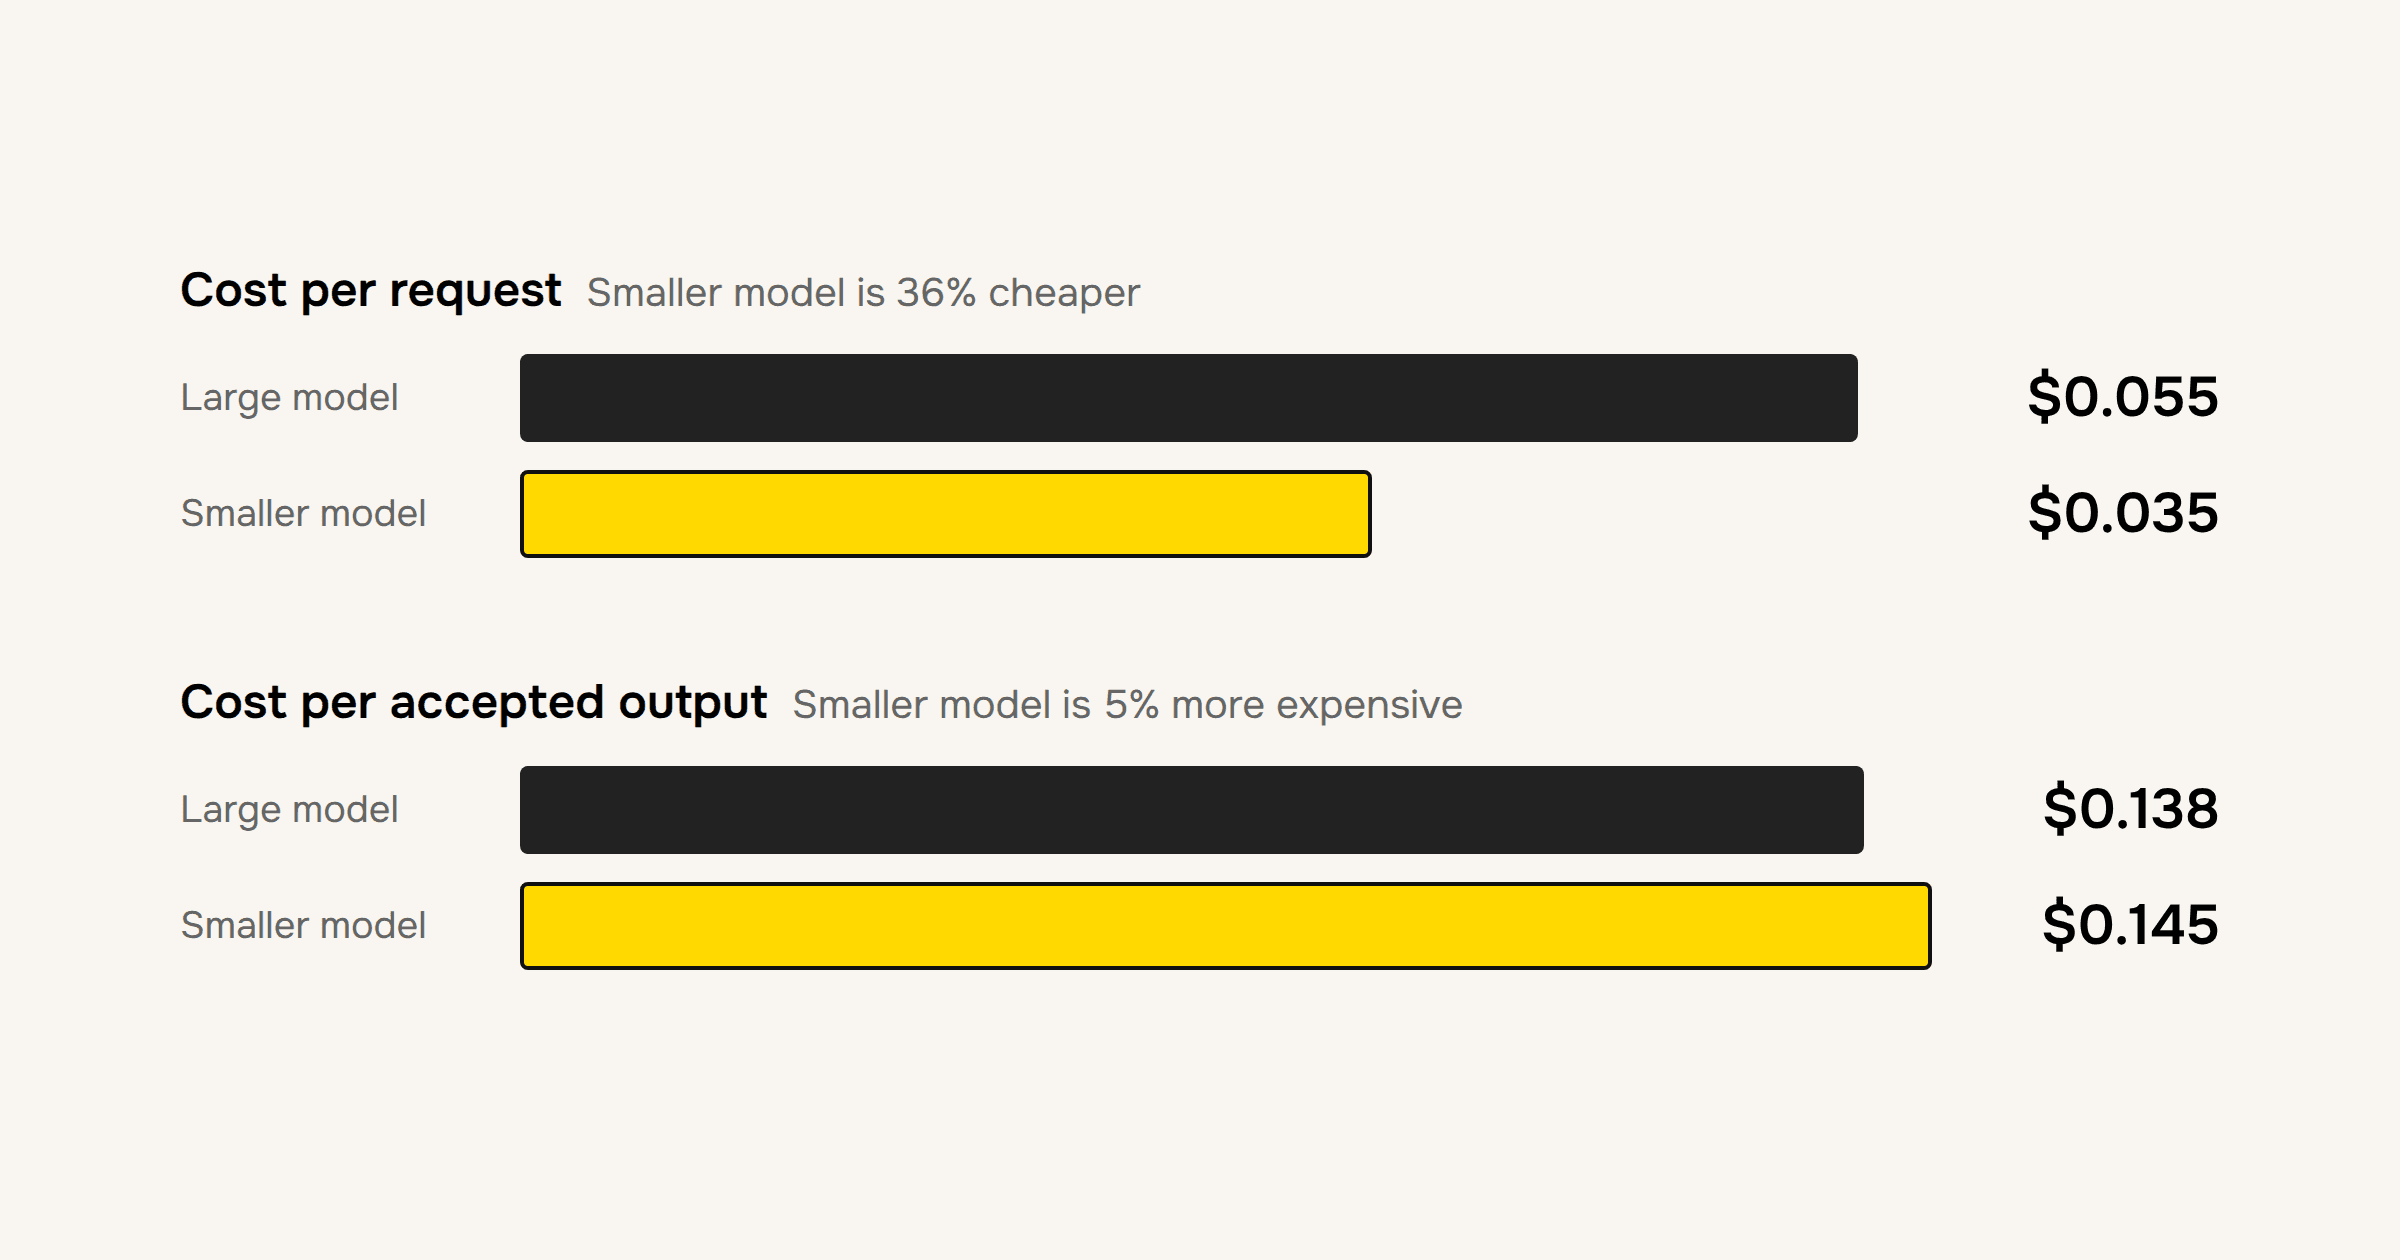
A smaller model can cut cost per request by a third and still cost more per useful answer. Measure the successful output, include the fixed cost every request carries, and both the model choice and the provider commitment change.
The model provider renewal arrives with a proposal: a three-year commitment at a 20 percent discount, sized on last quarter's growth. At the same time, the team has been testing a smaller model that costs half as much per inference. Both decisions are usually made on cost per call. Both can go wrong for the same reason: cost per call measures what the estate consumes, not what it delivers.
Why does cost per call mislead?
Take an illustrative example. An AI assistant handles 2.4 million requests a month on a large model, Model L. Inference costs $0.040 per request, and gateway, vector store and apportioned platform cost add $0.015 per request whether or not the answer is used. A four-week test on 10 percent of traffic compares a smaller model, Model M, at $0.020 per request for inference. Success is an accepted output: a response the user inserted or saved.
Option | Cost per request | Acceptance rate | Cost per accepted output | Accepted outputs a month | Cost a month |
All traffic on Model L | $0.055 | 40.0% | $0.138 | 960,000 | $132,000 |
All traffic on Model M | $0.035 | 24.2% | $0.145 | 580,800 | $84,000 |
Simple requests to M, complex to L | $0.048 | 39.2% | $0.122 | 940,800 | $115,200 |
Model M is 36 percent cheaper per request and 5 percent more expensive per accepted output, and it would cut accepted outputs by 40 percent. Routing only simple requests to it, where its acceptance rate is close to Model L's, reduces cost per accepted output by 11 percent for a 2 percent fall in accepted outputs. The routed figures include $0.001 per request for the classifier.
Why does cost depth change the answer?
On inference cost alone, Model M costs $0.083 per accepted output against $0.100 for Model L, so it looks 17 percent cheaper. Add the $0.015 of gateway, retrieval and platform cost that every request incurs, and the ranking reverses. A model that fails more often pays that fixed cost on more failed requests. Choosing the cost depth is therefore part of the decision, not an accounting detail, and the depth should be recorded beside the number every time it is shown.
What is the difference between unit costs and unit economics?
Cost per API call, per token or per gigabyte is unit costs: attributed cost divided by a technical volume. It is useful for running systems and negotiating rates. Unit economics divide attributed cost by a successful business output, such as an accepted output, a resolved contact or a completed workflow. The test is to look at the denominator: a technical volume gives unit costs, and a successful output gives unit economics.
How do you build it?
Start from the decision, not from the data that is easiest to reach.
Name the decision, its owner and its forum: the commitment level, decided by the CTO with procurement and finance at the renewal review.
Define success: efficiency, with a guardrail that accepted outputs stay within 3 percent of today.
Write the unit economic ratio in one sentence: cost per accepted output, by model and request type.
Specify each metric and its depth: what counts as a request, a retry and an accepted output, and which costs are included.
Audit what exists: here the provider export, gateway logs and product analytics share a request ID.
Take the cheapest path to the data: logs and exports you already have, plus one controlled test.
Model the decision: forecast spend from its drivers under each option, and test the assumptions across a range.
Assign an owner, a cadence and a forum: then check that the decision would change if the number came back at half or double.
What does it do to the commitment?
Forecasting year-one spend on Model L, with request growth from heavy accounts between 4 and 8 percent a month:
Scenario | Year-one spend on Model L, list price |
Status quo: all traffic on Model L | $1.38M to $1.56M |
Routing simple requests from month 3 | $0.91M to $1.02M |
Routing plus a planned pricing change | $0.85M to $0.93M |
The proposed $1.8 million a year is close to the status-quo run rate in month 12 multiplied by twelve. At a 20 percent discount it costs $1.44 million a year regardless of use, leaving roughly $0.6 million to $0.8 million unused each year in the routing scenarios. A commitment of about $0.85 million a year, with the right to increase, is covered in every routing scenario. The routing work takes two engineers about six weeks and pays back in about 2.5 months at current volume.
These figures are illustrative. The pattern is common: a cheaper option per call, a different answer per result, and a commitment sized on a trend that the routing decision is about to change.
Before your next renewal
Before you sign, ask for cost per accepted output by model and request type, at a stated cost depth, and a forecast of committed spend under the architecture you plan to run, not the one you run today. If the commitment only holds in the status-quo scenario, it is sized for the wrong estate. Hard to get a timely, consistent number? Get in touch with OPTIMAZE.
Get the full guide. The technology edition works this example through every step, with metric definitions, the data audit, the completed decision template and a starting library by team and business model. Do it yourself in a 60-day program, or with OPTIMAZE in a free two-week trial. Download the full guide. |
Subscribe to our blog.
Never more than once a week.