Technology spend is capital. Manage it that way.

Technology spend is capital. Manage it that way.

OPTIMAZE gives finance a meaningful figure for what technology spend produced, which investments are earning their place, and where the next dollar should go.

OPTIMAZE gives you a meaningful figure for what technology spend produced, which investments are earning their place, and where the next dollar should go.

Create Attribution Dimension
AI Assistant ✎ Manual Editor
How much are we spending on AI and what are we getting for it?
Joining spend across providers with the business signals…
Found it. $4.3M / year AI spend across OpenAI, Anthropic, Bedrock, Vertex and the cloud you run them on.
· Customer-facing AI · $2.6M$8.7M ROI (3.3× return)
· Internal eng · $1.4M17% productivity gain
· Infra & data · $0.3M

Customer-facing AI is paying for itself 3× over.
What should I scale or cut?
Comparing model performance and team productivity uplift…
Scale up: Customer-facing AI pays 3.3×. Recommendations leads at $3.2M ROI.
Pull back: claude-opus-4-7 on internal eng tasks — 2.4× the sonnet cost for a marginal quality gain. Move routine work to sonnet.
Productivity: Platform +28% with cursor-pro. Identity +4% on the same tool — investigate uptake.

Drill-down attached below ↓
Describe your attribution structure... How much are we spending on AI and what are we getting for it? what should I scale or cut?
Your graph will appear here
Create Attribution Dimension ✦ AI ASSISTANT
Your graph will appear here
How much are we spending on AI and what are we getting for it?
Joining spend across providers…
Found it. $4.3M/yr total AI spend.
Customer-facing $2.6M → $8.7M ROI.
Internal eng $1.4M · infra $0.3M.
What should I scale or cut?
Comparing ROI and uplift…
Scale customer-facing AI (3.3×).
Cut opus on routine eng tasks.
Drill-down above ↑
Describe your attribution structure... How much are we spending on AI and what are we getting for it? what should I scale or cut?

Technology investment is built in layers. So is the platform.

Investment Performance
AI ROI
Cost per Outcome
Revenue per Product
Pricing Intelligence
Portfolio Performance
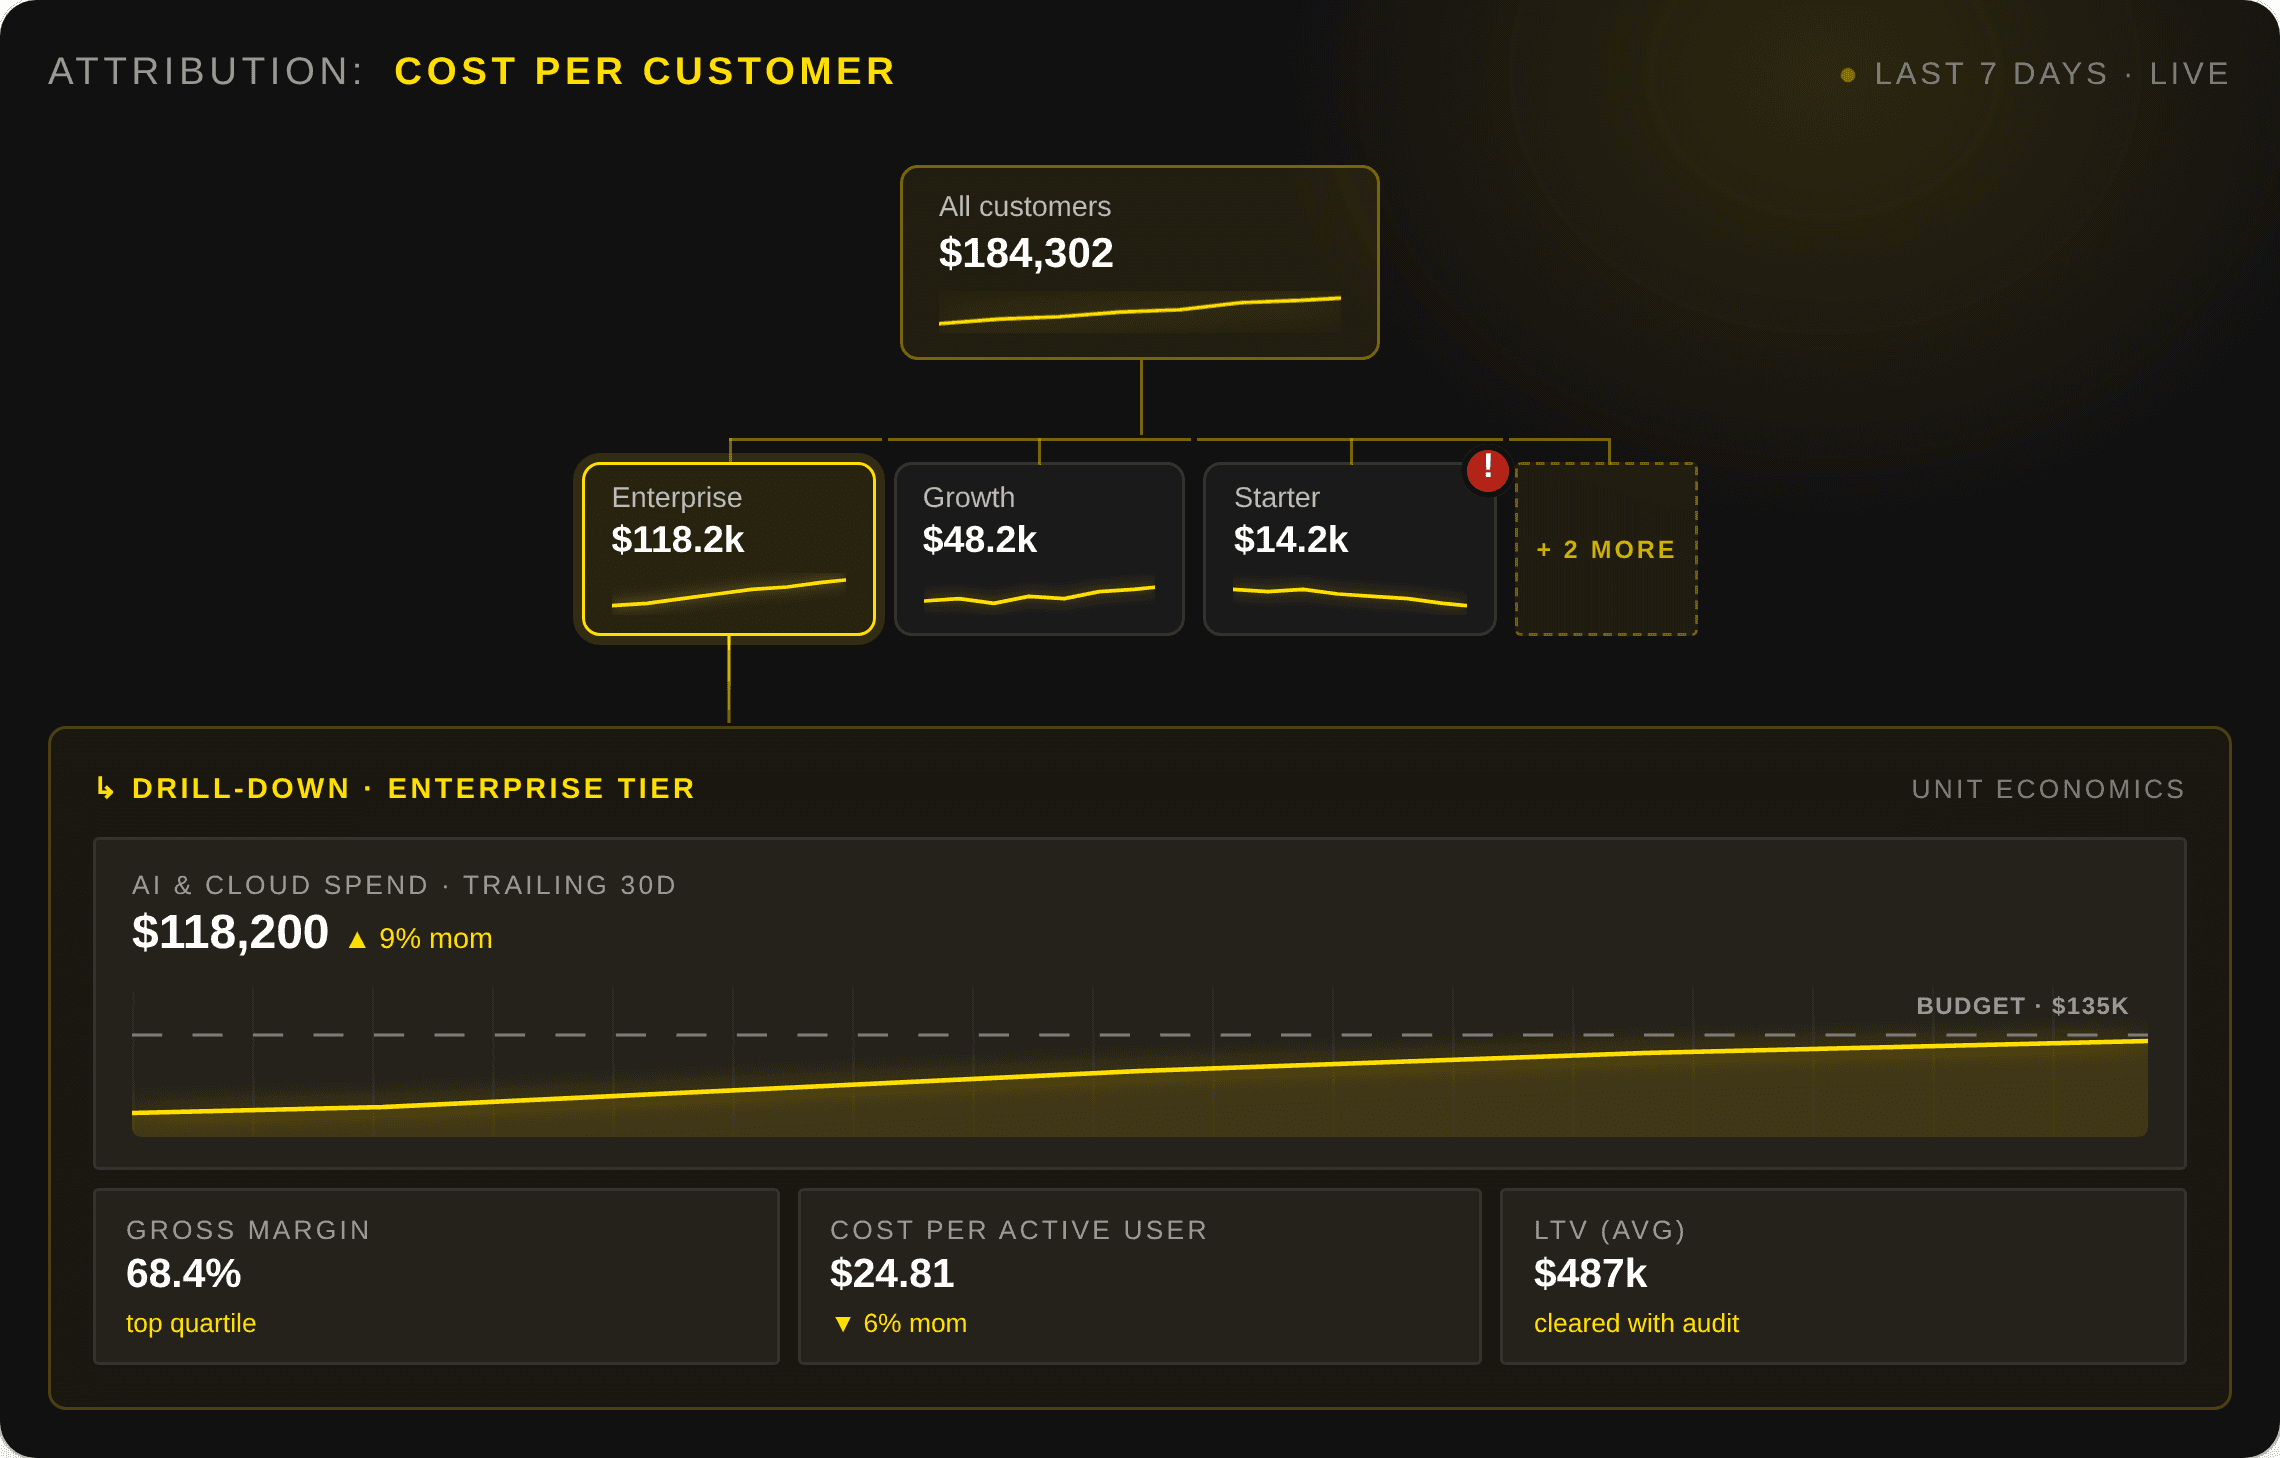
Unit Economics
Layer 3

Investment Performance

Understand what technology investment is producing. This is where the executive conversation happens.

Layer 2

Cost Attribution

Automate cost attribution to teams, products, customers, features and initiatives. Mathematical. Documented. Traceable.

Cost Attribution
Context-rich Data
Customisable Cost Dimensions
Granular Attribution
Real-time
Data Foundation
Infrastructure
Hosting
AI
SaaS
Business Context
Layer 1

Data Foundation

Bring AI, cloud, SaaS and infrastructure costs into a single economic model. Every provider. Every environment. One complete picture.

The questions finance actually get asked.

Built for what finance is accountable for. Every capability exists to answer one of these.

What does this AI feature cost to run, and what does it earn?

Token-level attribution mapped to feature usage, user cohort and business outcome. Not an estimate, a calculation.

What revenue is this investment generating?

Connect infrastructure spend to revenue-generating products and initiatives. See the return, not just the cost.

Which initiatives are earning their place?

Portfolio view of every technology investment ranked by return signal. Know what to double down on and what to stop funding.

Where should capital be reallocated?

Continuous signal on underperforming investment. Not a point-in-time audit, an ongoing view of where capital is working.

What you get.

The figures the platform produces, and where each one lands in a finance conversation.

AI ROI
Learn more
The return on AI investment, stated in business terms — not infrastructure metrics.
Unit Economics
Learn more
The cost of delivering a unit of value — per customer, per feature, per transaction.
Cost per Outcome
Learn more
What it costs to produce a defined business result. The number that answers the board question.
Portfolio Performance
Learn more
Which investments are earning their place. The view that becomes possible when Foundation and Attribution are in place.
Executive Investment Reporting
Learn more
Board-ready reporting that connects technology spend to business performance.

Most tools tell you what technology costs. OPTIMAZE tells you what it produces.

Economic Foundation

Your spend in one place

Cost data across every provider, environment and billing structure, continuously normalised and enriched. Not a manual import each month, a live economic model.

Attribution

A finance based cost model

Attribution is computed, not configured. Finance maps spend to its own financial model, without learning engineering's tagging convention or waiting for it to be applied across an estate finance does not control.

The Methodology

Mathematical. Documented. Traceable.

Every attribution decision is documented and traceable. You can take the number to the board and explain how it was derived. That is what makes it defensible.

The approach

You define the measurement. We return the number

OPTIMAZE does not decide what return means for your business. It produces the financial picture so you can. The definition of value stays with the organisation.

Start with the problem you already own.

Each solution addresses a specific domain of technology spend. The platform connects them to business context, so the outputs compound across your estate.

Solution

AI Economics

What is AI spend producing? Token-level attribution for every model, provider and feature, mapped to business outcome.

Explore solution

Solution

Cloud Economics

What is cloud spend producing? Full-estate visibility across all major providers and consumption mapped to workloads and business activity.

Explore solution

Coming Soon

SaaS Economics

Which licences are earning their place? Spend mapped to usage, adoption and business outcome across your SaaS estate.

Results when you need them

Attributed spend in an afternoon. Unit economics in days. No tagging programme and no data hygiene exercise standing in front of it.

See how AI is eating or growing your margins

Find out what your technology spend returned last year, and what it is returning now.

Technology Capital Performance helps organisations understand which technology investments are creating value, which are underperforming, and where capital should go next.

© 2026 Optimaze Services Pty Ltd

Technology Capital Performance helps organisations understand which technology investments are creating value, which are underperforming, and where capital should go next.

Technology Capital Performance helps organisations understand which technology investments are creating value, which are underperforming, and where capital should go next.